
Why Exit Survey Data Is Gold for Your Business
Acquiring a new customer costs five to seven times more than retaining an existing one. Yet most WordPress-based businesses have no systematic way of understanding why customers leave. They see a cancellation in their dashboard, maybe a support ticket if they are lucky, and that is it. The customer is gone, and the reason goes with them.
Exit surveys change this dynamic entirely. When a customer cancels a subscription, deletes their account, or downgrades their plan, a well-timed survey captures the reason while the customer is still engaged enough to tell you. This data is not just interesting. It is directly actionable. When 40 percent of churning customers say “too expensive,” you know pricing needs attention. When 25 percent say “missing feature X,” you know what to build next.
Companies that implement exit surveys and act on the data typically reduce churn by 10 to 20 percent within the first quarter. That is not a marginal improvement. For a subscription business doing $50,000 per month in recurring revenue, a 15 percent reduction in churn could mean an additional $90,000 in annual revenue.
In this guide, we will build a complete exit survey system for WordPress using WB Polls as the survey engine. You will learn how to trigger surveys on cancellation events, design questions that yield useful data, store and categorize responses, and build a dashboard that turns churn feedback into retention strategy.
Understanding Churn Trigger Points in WordPress
Before building the survey, you need to know where cancellations happen in your system. There are several trigger points depending on what you are running.
WooCommerce Subscriptions
If you sell subscriptions through WooCommerce, the primary cancellation hooks are:
- woocommerce_subscription_status_cancelled: Fires when a subscription status changes to cancelled. This is your main hook for exit surveys.
- woocommerce_subscription_status_pending-cancel: Fires when a customer initiates cancellation but it has not taken effect yet (for subscriptions that run until the end of the billing period). This is actually the better hook because you catch the customer at the decision point.
- woocommerce_subscription_status_expired: Fires when a subscription expires naturally. You might want a different survey for passive churn versus active cancellation.
Membership Plugins
For membership-based sites using plugins like Paid Memberships Pro or MemberPress, look for these hooks:
- Membership level change (downgrade to free or cancellation)
- Membership expiration
- Manual cancellation by admin
BuddyPress and Community Platforms
For community-based sites where users can delete their accounts or leave groups:
- delete_user: The WordPress core hook that fires before a user is deleted.
- bp_groups_leave_group: BuddyPress hook for when a member leaves a group.
- bp_core_pre_delete_account: BuddyPress hook that fires before account deletion.
Each of these trigger points is an opportunity to display an exit survey. The implementation approach is similar for all of them: intercept the cancellation flow, display the survey, capture the response, then proceed with the cancellation.
Designing Effective Exit Survey Questions
The questions you ask in an exit survey directly determine the usefulness of the data you collect. Here is how to design questions that give you actionable insights.
The Primary Reason Question
This is the most important question. It should be the first thing the customer sees, and it should offer clear, mutually exclusive options:
- Too expensive for the value provided
- Missing features I need
- Switching to a competitor
- No longer need this type of product
- Poor customer support experience
- Technical issues or bugs
- Too complicated to use
- Just testing, never intended to continue
- Other (with text field)
Notice that each option points to a specific area of your business. “Too expensive” is a pricing issue. “Missing features” is a product issue. “Switching to a competitor” is a positioning issue. “Poor support” is an operations issue. Each category has a different team and a different solution.
The Follow-Up Question
Based on the primary answer, show a relevant follow-up:
- If “too expensive”: “Would any of the following have helped?” (Options: lower price, annual discount, usage-based pricing, feature-limited free tier)
- If “missing features”: “Which feature would have made the biggest difference?” (Options pulled from your feature request board or product roadmap)
- If “switching to competitor”: “Which competitor are you switching to?” (Options: list your known competitors plus “other”)
- If “poor support”: “What would have improved your support experience?” (Options: faster response, more knowledgeable agents, self-service docs, live chat)
The Recovery Question
The final question should test whether the churn is recoverable:
“Would anything change your mind about leaving?” Options:
- A discount on my next billing period
- A call with the product team to address my concerns
- Nothing, my decision is final
- I would come back if [specific feature] was added
This question serves double duty. It collects data about what drives retention, and it can trigger an immediate save attempt. If a customer selects the discount option, your system can automatically present an offer.
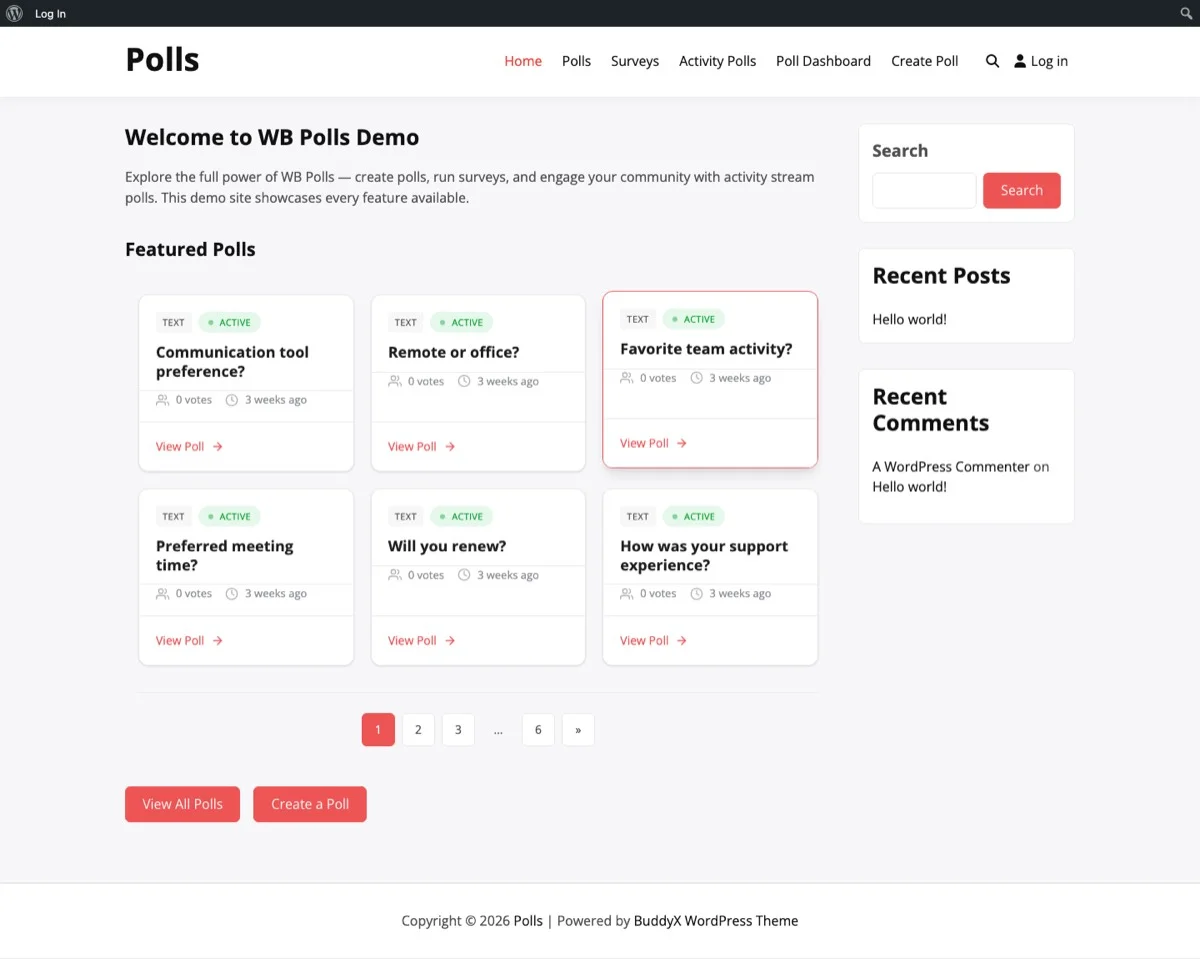
WB Polls grid layout provides the foundation for organizing exit survey questions into a structured, easy-to-navigate format.
Triggering the Exit Survey on Cancellation
The implementation has two approaches depending on your cancellation flow: inline (blocking) and redirect (non-blocking).
Approach 1: Inline Modal Survey
When the customer clicks the cancel button, intercept the action with JavaScript and display a modal overlay containing the survey. The cancellation does not proceed until the customer either completes the survey or explicitly skips it.
This approach yields the highest response rates (70 to 90 percent) because the survey is mandatory to proceed. However, it must include a clear skip option. Forcing a customer to answer a survey before letting them cancel creates frustration and potential legal issues.
The implementation involves:
- Intercepting the cancel button click event with JavaScript.
- Preventing the default form submission.
- Loading the WB Polls survey in a modal overlay.
- Capturing the poll responses via AJAX.
- Proceeding with the cancellation after the survey is completed or skipped.
Approach 2: Redirect to Survey Page
After the customer confirms cancellation, redirect them to a dedicated survey page. This is less intrusive but gets lower response rates (30 to 50 percent) because the customer can simply close the tab.
The advantage is simplicity. You create a page with the survey shortcodes, pass the user ID and subscription ID as URL parameters, and let WB Polls handle the voting. No custom JavaScript modal required.
Implementation Tips
- Always allow skipping: Never force a customer to complete a survey. It is bad UX and may violate consumer protection laws in some jurisdictions.
- Keep it fast: The survey should load in under one second. Preload the poll data when the cancellation page loads, not when the customer clicks cancel.
- Mobile-first: Many cancellations happen on mobile devices. The survey modal must work perfectly on small screens.
- Save partial responses: If a customer answers the first question but skips the rest, save what you got. Partial data is better than no data.
Hooking into Account Deletion Events
Account deletion is different from subscription cancellation. When a customer deletes their entire account, you are losing all future revenue potential, not just one subscription. The survey approach needs to account for this.
The WordPress Account Deletion Flow
WordPress triggers the delete_user action before removing a user from the database. You can hook into this to display a survey, but there is a timing challenge: once the user is deleted, you cannot store the response linked to their user ID.
The solution is to capture the survey response before the deletion proceeds. Use the wp_ajax_delete_user hook to intercept the request, display the survey, store the response with the user’s data (anonymized if needed), and then proceed with deletion.
BuddyPress Account Deletion
BuddyPress has its own account deletion flow through the Settings section. The bp_core_pre_delete_account hook fires before the account is removed. Hook into this to redirect the user to a survey page before the deletion completes.
Store the following data with the exit survey response:
- Account age (how long they were a member)
- Membership level at time of deletion
- Last activity date
- Number of previous purchases or interactions
- Survey responses (anonymized)
This context makes the survey data much more valuable. Knowing that a 2-year member on the premium plan churned because of “missing features” carries more weight than the same response from a 1-week-old free account.
Categorizing Churn Reasons for Analysis
Raw survey responses need categorization to be useful at scale. Build a taxonomy of churn reasons that maps to your business functions.
Primary Categories
- Price-related churn: The customer found the product too expensive or found a cheaper alternative. This is a pricing and positioning problem.
- Product-related churn: Missing features, bugs, complexity, or poor performance. This is a development and UX problem.
- Service-related churn: Poor support, slow response times, unhelpful documentation. This is an operations problem.
- Needs-based churn: The customer no longer needs the product. Their business changed, they switched industries, or the problem was solved. This is largely unavoidable but worth tracking.
- Competitive churn: The customer is switching to a named competitor. This is a market intelligence goldmine.
- Involuntary churn: Payment failures, expired cards, billing issues. This is a payment recovery problem with specific technical solutions.
Mapping Poll Answers to Categories
Each answer option in your WB Poll maps to one of these categories. Store the category alongside the specific answer so you can analyze both the granular responses and the high-level trends. For example, “too expensive for the value provided” maps to price-related churn, while “too complicated to use” maps to product-related churn.
Tracking Category Trends Over Time
The real power of categorization is trend analysis. If price-related churn was 20 percent of all churn last quarter but jumped to 35 percent this quarter, something changed. Maybe a competitor dropped their price. Maybe you raised yours. Maybe your value proposition is no longer resonating. The trend tells you to investigate.
Building a Churn Dashboard
The churn dashboard is where all of this data comes together. Build it as a custom admin page in WordPress that gives your team a complete picture of why customers are leaving.
Dashboard Sections
Section 1: Churn Overview
- Total cancellations this month
- Survey response rate
- Top churn reason (percentage and count)
- Churn rate trend (monthly line chart)
Section 2: Reason Breakdown
- Pie chart of churn reasons by category
- Table showing each reason with count, percentage, and month-over-month change
- Ability to drill into individual responses
Section 3: Recovery Opportunities
- Number of customers who indicated willingness to stay with intervention
- Breakdown by recovery type (discount, feature, support call)
- Success rate of recovery attempts
Section 4: Competitive Intelligence
- Which competitors are customers switching to
- Trend over time (is one competitor gaining ground?)
- Correlated reasons (why customers choose each competitor)
Section 5: Cohort Analysis
- Churn reasons segmented by customer tenure
- Churn reasons segmented by plan tier
- Churn reasons segmented by acquisition channel
Building the Dashboard with WordPress
Register a custom admin page using add_menu_page(). Enqueue Chart.js for visualizations. Query your survey response table to build the datasets. Use WordPress transients to cache the aggregated data so the dashboard loads quickly even with thousands of responses.
For the date range selector, use a simple dropdown with options like “Last 7 days,” “Last 30 days,” “Last quarter,” and “Custom range.” Each selection re-queries the data and updates the charts via AJAX.
Using Churn Feedback to Improve Retention
Collecting data is pointless if you do not act on it. Here is how to turn exit survey insights into retention improvements.
Immediate Recovery Automation
Set up automated recovery flows based on survey responses:
- Price-sensitive churners: Automatically offer a 30 percent discount on the next billing period. Send the offer immediately after the survey response.
- Feature-missing churners: Add them to a notification list for when the requested feature ships. Send a “we heard you” email with a timeline if available.
- Support-frustrated churners: Route their feedback to the support manager with a flag for personal outreach within 24 hours.
- Competitor-switching churners: Trigger a comparison email highlighting your advantages over the named competitor.
Monthly Churn Review Process
Establish a monthly meeting where key stakeholders review the churn dashboard. The agenda should cover:
- Top churn reasons and trends versus previous month
- Recovery attempt success rates
- Competitive intelligence updates
- Action items for product, support, and marketing teams
- Progress on previous month’s action items
Product Roadmap Integration
Feed the “missing features” data from exit surveys into your feature request voting board (which you can also build with WB Polls, as covered in our companion guide). When churning customers identify missing features, those features should get weighted votes on your roadmap. A feature request backed by churn data is more urgent than one from a feature wish list.
Pricing Strategy Adjustments
If price-related churn exceeds 30 percent of total churn, it signals a systemic pricing issue. The exit survey data tells you exactly what adjustments customers want: lower prices, annual discounts, usage-based pricing, or a free tier. Run this data alongside your revenue analysis to find pricing changes that reduce churn without destroying margins.
Technical Implementation Details
Here are the key technical considerations for building a reliable exit survey system.
Database Schema
Create a dedicated table for exit survey responses. Do not rely solely on WB Polls’ built-in vote storage because you need additional context fields that polls do not track by default:
- response_id: Auto-increment primary key
- user_id: The churning customer (set to 0 after account deletion for privacy)
- subscription_id: WooCommerce subscription ID if applicable
- churn_type: Cancellation, downgrade, account deletion, or expiration
- primary_reason: Category code from the first question
- specific_answer: The exact answer selected
- followup_answer: Response to the conditional follow-up
- recovery_willingness: Their response to the recovery question
- customer_tenure_days: How long they were a customer
- plan_tier: Their subscription or membership level
- lifetime_value: Total revenue from this customer
- created_at: Timestamp
Privacy and Data Handling
When a customer requests account deletion, anonymize their exit survey data rather than deleting it. Replace the user_id with 0 and remove any personally identifiable information. The aggregated data remains valuable for trend analysis even without personal identification.
Add your exit survey to your privacy policy disclosure. Customers should know you collect cancellation feedback and how you use it.
Performance Optimization
- Index key columns: Add database indexes on churn_type, primary_reason, and created_at for fast dashboard queries.
- Cache dashboard data: Use WordPress transients with a 1-hour expiration for the dashboard aggregations.
- Lazy load the modal: If using the inline approach, do not load the survey HTML until the cancel button is clicked.
- Async response storage: Use the WordPress REST API or admin-ajax to store responses asynchronously so the cancellation flow is not delayed.
Measuring the Impact of Exit Surveys
How do you know if your exit survey system is actually reducing churn? Track these metrics from day one.
Leading Indicators
- Survey completion rate: Target above 50 percent. Below 30 percent means your survey is too long or poorly timed.
- Recovery offer acceptance rate: What percentage of customers who see a recovery offer take it? This tells you if your save attempts are calibrated correctly.
- Action item completion rate: Are you actually implementing changes based on survey feedback? Track this monthly.
Lagging Indicators
- Overall churn rate: The primary metric. Compare monthly and quarterly trends before and after implementing the survey system.
- Reason-specific churn reduction: If you addressed the top churn reason from last quarter, did that category decrease this quarter?
- Customer lifetime value: Are customers staying longer on average since you started acting on feedback?
- Revenue retention rate: The percentage of recurring revenue retained month over month. This accounts for both churn and expansion revenue.
Start Capturing Exit Feedback Today
Every customer who leaves without telling you why is a missed learning opportunity. Exit surveys turn departures into data, and data into strategy. The customers who are leaving are telling you exactly what you need to fix to keep the ones who are staying.
WB Polls provides the survey infrastructure: multi-option polls, AJAX voting, duplicate prevention, and results tracking. Combined with WordPress hooks for subscription cancellation and account deletion events, you have everything needed to build a comprehensive exit survey system.
The implementation takes a day. The insights it generates compound over months and years. Start with the primary reason question, build from there, and watch your churn data transform from a mystery into a roadmap for retention.
Get WB Polls and turn every customer departure into an opportunity to improve your product and reduce future churn.