
Why Most Ad Placements Never Get Optimized
Here is a pattern that plays out on thousands of WordPress sites every day. A site owner creates an ad placement. They upload a banner. They drop a shortcode into a sidebar widget or a template file. Traffic flows, some people click, and the ad sits there unchanged for months or years.
The ad might be performing well. It might be performing terribly. Without testing alternatives, there is no way to know. The original creative becomes the default not because it earned its position, but because no one took the time to challenge it.
This is a missed opportunity that compounds over time. A banner with a 0.3% click-through rate might seem acceptable until you discover that a different headline or color scheme pushes CTR to 0.8%. On a site serving 100,000 impressions per month, that difference represents 500 additional clicks, which could translate to thousands of dollars in revenue or conversions.
The reason most placements never get optimized is not laziness. It is friction. Traditional A/B testing for ads requires either expensive third-party platforms, custom JavaScript implementations, or manual processes that involve swapping creatives and comparing date ranges. None of these approaches integrate cleanly with WordPress ad management workflows.
WB Ad Manager Pro changes this by building A/B testing directly into the ad management system. Creating a test is as straightforward as creating an ad. No external tools, no custom code, no manual date-range comparisons. If you are already using the plugin to track impressions and clicks, A/B testing is a natural next step.
A/B Testing Fundamentals for Display Ads
Before diving into implementation, let us establish what A/B testing actually means in the context of display advertising on WordPress.
The Core Concept
An A/B test (also called a split test) presents two or more variants of an ad to different segments of your traffic. Each visitor sees only one variant during the test period. After enough data accumulates, you compare the performance of each variant to determine which one drives better results.
The key principle is controlled comparison. By showing variants to similar audiences under similar conditions, you isolate the impact of the change you are testing. If Variant B gets more clicks than Variant A, and the only difference is the headline text, you can confidently attribute the performance difference to the headline.
What You Can Test
Display ad A/B tests typically focus on one variable at a time:
- Creative elements – Different images, illustrations, or photographs
- Headlines – Varying the text overlay or call-to-action copy
- Color schemes – Testing different background colors, button colors, or text colors
- Call-to-action text – “Learn More” vs. “Get Started” vs. “Download Now”
- Ad format – Static image vs. animated GIF vs. HTML5
- Landing page URL – Same ad creative pointing to different destination pages
Testing one variable at a time is critical. If you change both the image and the headline between Variant A and Variant B, and Variant B wins, you do not know which change drove the improvement. This distinction matters when building a library of insights about what works for your audience.
Sample Size and Statistical Validity
The most common mistake in ad testing is calling a winner too early. If Variant A has 50 impressions and 3 clicks (6% CTR) while Variant B has 50 impressions and 1 click (2% CTR), the difference might look significant. But with sample sizes this small, random variation easily explains the gap.
Statistical significance is the measure of whether an observed difference is likely real or likely due to chance. In practice, you want at least 95% confidence that the winning variant is genuinely better, not just luckier.
The sample size required depends on the baseline CTR and the minimum detectable effect. For a typical display ad with a 0.5% baseline CTR, detecting a 50% improvement (to 0.75% CTR) at 95% confidence requires approximately 30,000 impressions per variant. For higher-CTR placements, fewer impressions are needed.
Setting Up Variants with Traffic Splits
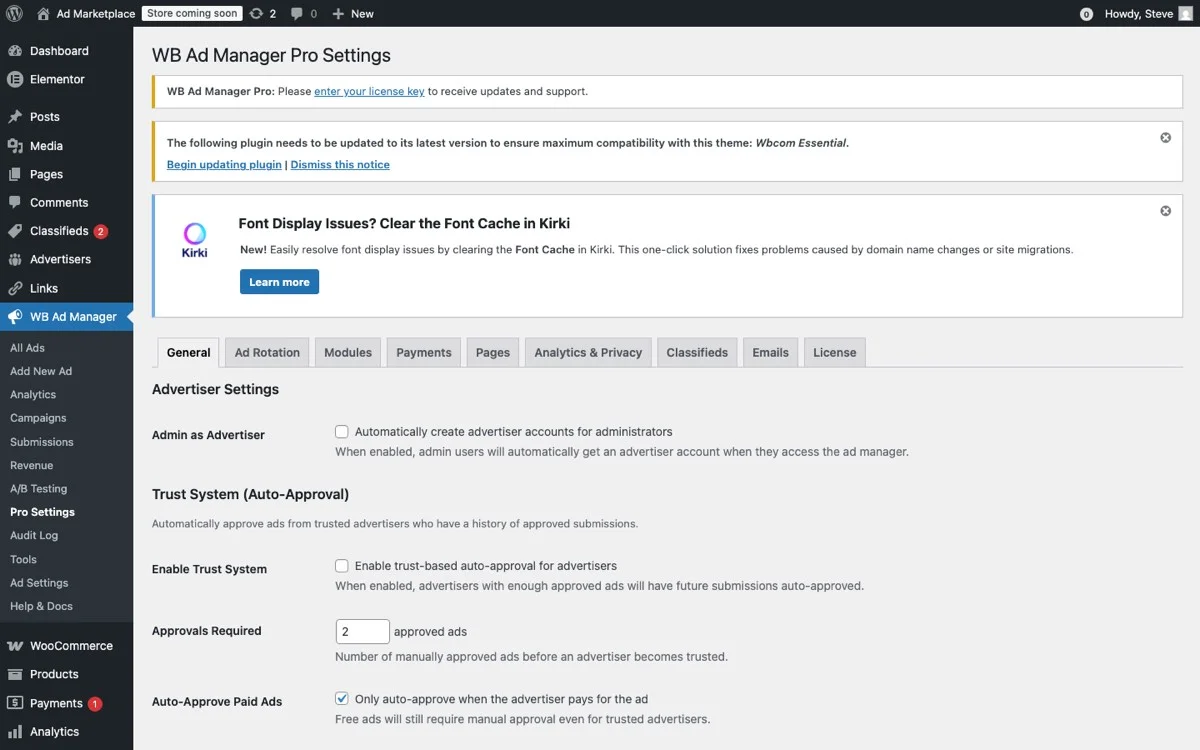
WB Ad Manager Pro makes creating A/B tests a natural extension of the ad creation workflow. Here is how to set up your first test.
Step 1: Create the Control Ad
Start by creating (or selecting) the ad that will serve as your control, the current version that you want to test against. This is Variant A. Make sure it has been running long enough to establish a baseline performance metric.
Step 2: Create the Challenger Variant
Navigate to the ad’s settings and click Add Variant. Upload the new creative, adjust the headline, or change whatever single element you are testing. WB Ad Manager Pro automatically labels this as Variant B.
You can add up to four variants for multivariate tests (A/B/C/D), though two variants is the recommended starting point. More variants require proportionally more traffic to reach statistical significance.
Step 3: Configure the Traffic Split
By default, traffic is split evenly between variants (50/50 for two variants, 33/33/34 for three). You can adjust these percentages if you want to limit exposure to an untested variant.
A common approach is to use an 80/20 split for the initial phase: 80% of traffic sees the proven control while 20% sees the challenger. This limits risk if the new variant performs poorly. Once the challenger shows promise, you can adjust to 50/50 for faster data collection.
// Traffic split configuration example
$test_config = array(
    'ad_id'    => 142,
    'variants' => array(
        array(
            'id'     => 'A',
            'weight' => 80,  // 80% of traffic
            'creative_id' => 301,
        ),
        array(
            'id'     => 'B',
            'weight' => 20,  // 20% of traffic
            'creative_id' => 302,
        ),
    ),
    'metric'   => 'ctr',  // Optimize for click-through rate
);
Step 4: Set the Test Duration
Define a minimum test duration or a minimum sample size. WB Ad Manager Pro supports both approaches:
- Duration-based – Run the test for a specified number of days (e.g., 14 days minimum)
- Sample-based – Run until each variant reaches a specified number of impressions (e.g., 10,000 per variant)
- Significance-based – Run until the result reaches a specified confidence level (e.g., 95%)
The significance-based approach is the most statistically sound, but it can result in very long-running tests for low-traffic placements. For most sites, a combination of minimum duration (7 days to account for day-of-week variations) and minimum sample size provides the best balance.
Step 5: Launch the Test
Click Start Test. WB Ad Manager Pro begins splitting traffic according to your configuration. The test dashboard shows real-time performance data for each variant, including impressions, clicks, CTR, and the current confidence level.
Understanding Statistical Significance in Practice
Statistical significance is not a binary switch that flips at exactly 95%. It is a continuum that reflects your confidence in the observed difference.
How the Calculation Works
WB Ad Manager Pro uses a two-proportion z-test to compare CTR between variants. The test calculates the probability that the observed difference in CTR could have occurred by random chance alone.
If Variant A has a 0.5% CTR over 20,000 impressions and Variant B has a 0.7% CTR over 20,000 impressions, the z-test determines whether this 0.2 percentage point difference is statistically meaningful given the sample sizes.
The result is expressed as a confidence percentage. A confidence level of 95% means there is only a 5% probability that the observed difference is due to chance. At 99% confidence, there is only a 1% probability.
Reading the Confidence Indicator
The test dashboard displays a confidence indicator next to each test:
- Below 80% – Too early to draw conclusions. Keep the test running.
- 80% to 90% – A trend is emerging but is not yet reliable. Consider extending the test.
- 90% to 95% – Strong evidence of a real difference. Sufficient for most ad optimization decisions.
- Above 95% – High confidence. Safe to declare a winner and apply the results.
- Above 99% – Very high confidence. The difference is almost certainly real.
Common Pitfalls
Peeking too often. Checking results multiple times and stopping the test as soon as one variant pulls ahead inflates the false positive rate. This is called the “peeking problem” and is one of the most common A/B testing mistakes. WB Ad Manager Pro mitigates this by showing the confidence level prominently and warning when sample sizes are too small for reliable conclusions.
Ignoring day-of-week effects. Traffic patterns vary by day of the week. A test that runs only from Monday to Wednesday misses weekend traffic, which may behave differently. Always run tests for at least one full week, ideally two.
Testing too many things at once. Running five tests simultaneously on the same page can create interactions between tests. If a visitor sees new Variant B in the header and new Variant B in the sidebar, their behavior may be influenced by the combination rather than either change alone. Run tests sequentially on the same page, or use multivariate testing methodology if you must test simultaneously.
Auto-Winner Detection
Manually monitoring every A/B test and deciding when to declare a winner is practical when you have one or two tests running. When you have ten or twenty, it becomes a management burden.
WB Ad Manager Pro includes an auto-winner detection feature that monitors running tests and automatically applies the winning variant when configurable criteria are met.
How Auto-Winner Works
You define the auto-winner criteria when setting up the test:
- Minimum confidence level – Typically 95% (configurable from 80% to 99%)
- Minimum sample size – A floor to prevent premature decisions even if confidence is high
- Minimum test duration – Ensures at least one full business cycle is captured
When all three criteria are met, the plugin automatically:
- Marks the test as complete
- Sets the winning variant as the active creative for the placement
- Pauses traffic splitting so 100% of impressions go to the winner
- Logs the test results for historical reference
- Sends an email notification to the site admin and/or advertiser
Manual Override
Auto-winner is a convenience feature, not a mandate. You can always override the automatic decision. If a test declares Variant B the winner but you have external context (such as an upcoming campaign change) that makes Variant A more appropriate, you can manually select the active variant.
You can also disable auto-winner entirely and manage all test conclusions manually. This is the recommended approach when you are first getting comfortable with A/B testing and want to review every result before applying it.
Sequential Testing
Once a winner is declared, it becomes the new control for the next test. This creates a continuous optimization cycle:
- Test A vs. B. B wins.
- B becomes the new control. Test B vs. C.
- B wins again. Test B vs. D.
- D wins. D becomes the new control.
Over time, this iterative approach converges on the best-performing creative for each placement. Each test builds on the insights from the previous one, creating a compounding improvement effect.
Testing Beyond Creative: Placements, Timing, and Targeting
Creative testing (images, headlines, CTAs) is the most common form of ad A/B testing, but it is only one dimension of optimization. WB Ad Manager Pro supports testing across several additional dimensions.
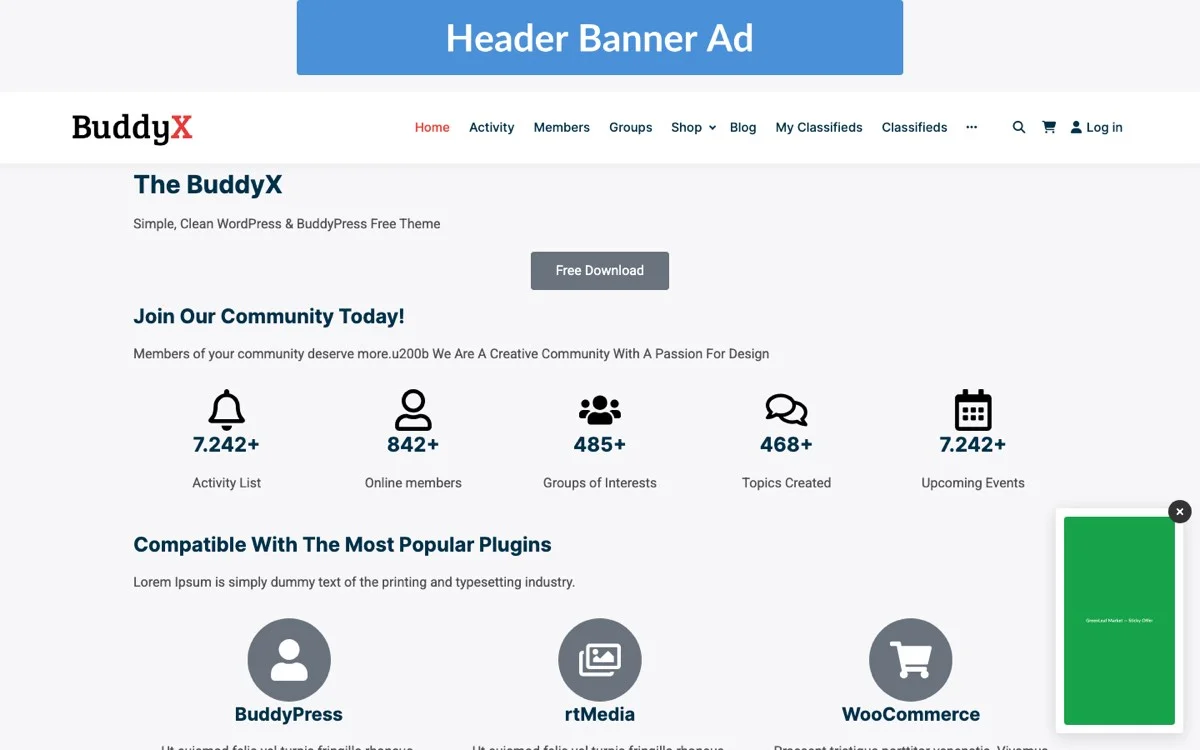
Placement Testing
The same ad creative can perform very differently depending on where it appears on the page. A leaderboard banner in the header gets high visibility but may suffer from banner blindness. An in-content placement between paragraphs catches readers when they are actively engaged. A sticky sidebar ad maintains visibility during scrolling but may feel intrusive.
Placement testing in WB Ad Manager Pro works by creating the same ad in multiple placements and comparing performance metrics. The plugin tracks each placement independently, so you can directly compare CTR for the same creative across different page positions.
This is not a traditional A/B test (since different users may see the ad in different placements on the same page), but it provides actionable data about which placements drive the most engagement for specific ad types.
Timing and Scheduling Tests
Ad performance varies by time of day and day of week. A B2B software ad might perform best during business hours on weekdays, while an entertainment ad might peak on evenings and weekends.
WB Ad Manager Pro’s scheduling system lets you run the same ad on different schedules and compare the results. For example:
- Variant A – Runs 24/7
- Variant B – Runs only during business hours (9 AM – 5 PM weekdays)
- Variant C – Runs only during evenings and weekends
By comparing CTR and total engagement across these schedules, you can identify the optimal display windows for each ad. This is particularly valuable for sites with limited ad inventory where you want to maximize the impact of each impression.
Audience Targeting Tests
If your site has user roles or membership levels, you can test how the same ad performs across different audience segments. WB Ad Manager Pro supports targeting rules based on:
- User role – Show different ads to subscribers vs. contributors vs. administrators
- Login status – Test whether logged-in users engage differently than anonymous visitors
- Geographic location – Compare performance across regions (requires a geolocation integration)
- Device type – Mobile vs. desktop vs. tablet performance
- Referral source – Visitors from search vs. social vs. direct
Audience-based tests help you understand not just which creative works best overall, but which creative works best for each segment. This enables personalized ad experiences that drive higher engagement across the board.
Landing Page Tests
A/B testing does not stop at the ad itself. The post-click experience matters just as much. WB Ad Manager Pro lets you assign different click-through URLs to each variant, enabling you to test different landing pages with the same ad creative.
While conversion tracking on the landing page requires additional setup (either a tracking pixel or server-side callback), the plugin tracks clicks to each URL variant and reports on click-through rates per landing page.
Advanced Testing Strategies
Multivariate Testing
When you have enough traffic, multivariate testing lets you test multiple elements simultaneously. Instead of testing one headline against another, you test combinations: Headline A + Image 1, Headline A + Image 2, Headline B + Image 1, Headline B + Image 2.
This requires four times the traffic of a simple A/B test but reveals interaction effects. Maybe Headline A works best with Image 1, but Headline B works best with Image 2. A sequential A/B approach might never discover this combination.
WB Ad Manager Pro supports up to four variants per test, making it practical to run multivariate tests on high-traffic placements. Developers who want to automate test creation and management can do so through the REST API.
Seasonal Testing Cadence
Smart advertisers align their testing schedule with their business calendar. Run creative tests in the weeks leading up to peak seasons so that your best-performing variants are in place when traffic spikes. During peak periods, focus on placement and timing tests that maximize the value of each impression.
Building a Test Library
Every completed test generates an insight. Over time, these insights form a library of knowledge about what works for your specific audience. WB Ad Manager Pro stores the complete history of all tests, including variants, sample sizes, confidence levels, and outcomes.
This historical data is invaluable for onboarding new advertisers. Instead of starting from scratch, you can share aggregated insights: “In-content placements outperform sidebar placements by 2x on this site” or “Red CTA buttons consistently beat blue by 15%.” Agencies managing multiple stores can combine these insights with their CRM-driven customer management workflows for a complete optimization picture.
Get Started with A/B Testing
Every ad on your site is either optimized or leaving performance on the table. A/B testing with WB Ad Manager Pro gives you the tools to systematically improve every placement, backed by statistical rigor and automated winner detection.
Stop guessing which creatives work. Start testing.
Download WB Ad Manager Pro and run your first A/B test today.